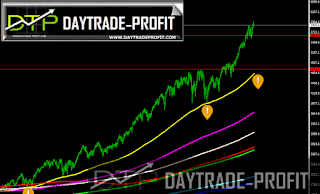
Are financial markets entering To the rising stage of the bubble phase, or face the falling period
Are financial markets entering the bubble stage in asset prices
Almost ¾ quarter of this year past – the markets archives strong high yields as I expected
Stocks prices combine index prices look a bit pumping, but is this the end?
Well as you all known my opinion about the situation we are stay in – 1998-1999 period time remind me the same situation - wrote about this in my post many times
in last may I upload a post on bubble stage in the financial markets – expect for some corrections, markets really made some sharp & fast corrections
Now it's time to check what's next. The outlook for the 21,700 points area in Dow Jones has materialized - Dow Jones price levels for 31.7.2017 is in 21,764 pints
 |
| Dow Jones forecast |
Background noises are no small matter
The dollar shows weakness on several factors
The shares continue to go - the companies' reporting season is at its peak, The vast majority of the leading companies are now at an all-time high
On the other hand, in the global general context, there are several factors that should not be underestimated:
Data from recent months have shown clearly that despite the economic improvement in the US economy, wages and inflation simply refuse to rise at a rate that supports the continuation of the process of normalization of monetary policy. On the face of it, in such a situation, the Fed was supposed to clearly signal to the markets that the interest rate hikes and the plan to reduce the balance sheet were frozen for the time being. In practice, Fed did not do so and chose to keep very vague messages and even increased when they noted their concern about price levels in the financial markets.
The perception that global growth will continue to be positive and the interest rate is low is the main driver today in the markets because in such a situation there are simply no suitable alternatives. However, it is important to note that this is a perception that is appropriate for the current state of the world, a situation that is not necessarily (or necessarily will not) forever
Russia, The US Congress approved new sanctions against Russia because of its intervention in the US presidential election, and the Kremlin promised a response and held: The Russian president ordered the expulsion of hundreds of American diplomats from his country and the confiscation of US assets and China as above - dissatisfaction with North Korea's conduct
Trump has been zigzagging and in the meantime is not providing results - his failed attempts to cancel Obama-Kier and more
In its global policy, from its withdrawal from the Paris Agreement, the whole intervention in the crisis in the Persian Gulf, and its attitude to the NATO alliance and now with North Korea do not show direction and a worthy captain who can navigate such a large Ship as the US
one more thing on economic indicator - Case Shiller and the earnings multiplier he created
CAPE: Price earnings ratio is based on average inflation-adjusted earnings from the previous 10 years, known as the Cyclically Adjusted PE Ratio (CAPE Ratio), Shiller PE Ratio
Indicates that the current P / E based on the adjusted average profit for the past 10 years is over 30. This is important because the only times this figure was higher were before the Great Depression of 1929 and between mid-1997 and mid-2001.
the markets have their own behavior usually when everyone is afraid then the tendency is to rise, and when everyone is happy and euphoric they suddenly change direction and begin to fall
 |
| markets bubble |
Now let’s go to my favorite part as you all know technical analysis and charts view
I see fit to show you two scenarios for the next move in the markets
If we are like 1999 and go into the bubble and euphoria stage, friends have seen a fast and deadly rally here, although some of you will see it as a flower, and how can it be that after so many years of increases it does not end and the markets do not accumulate the appropriate risks? Usually, they know how to surprise and to do things that are obviously illogical
If this is indeed the case then there are new numbers to draw for you, final goals for the markets bubble will call it.
The second scenario is Realizations in the markets
 |
| markets forecast |
Now with your permission, I will go to the NASDAQ chart, because once there was already a sharp bubble, so it is easy to bring it as an example
We can see some support areas on the chart: first support stay in 5640 _+ points price area second in 5460+_ points area (major support) and last stay in 5180+_ price area
I have 2 scenarios for the future to come
The first scenario is the entry into the bubble phase of the index, ie, a sharp and fast climb to high areas, an area of 7200 points + _, assuming that 5460 points will hold
The second scenario is the beginning of a downward trend and a strong correction to the upward trend that has been going on for more than 9 years. At this stage, we would like to see at least the 4650 level on the screens
In any case, what will not happen is very close to my taste
 |
| markets prediction |
This review does not including any document and/or file attached to it as an advice or recommendation to buy/sell securities and/or other advice


No comments:
Post a Comment