Why the Markets Afraid from Fed interest Rate Decision
Why the Markets Afraid from Fed interest Rate Decision
It is broadly expected, the Fed won't raise rates, particularly since the European Central Bank cut rates this previous week.
Work labor power support rate is currently 0.5 rate focuses over its September low. Accepting this pattern will proceed with, the US economy can support genuinely solid occupation development while unemployment rates float bring down extremely continuous, in accordance with the Fed's desires. It would likewise give the Fed more breathing room concerning raising rates.
The security business sector is boosting its wagers on a Federal Reserve loan cost increment in June as stocks and oil rally.
After Treasury 10-year notes recorded a third straight week by week decay, bond market dealers now see the chances of a June rate trek at around a coin flip, as per prospects information accumulated by Bloomberg. That is up from a 45 percent chance doled out March 10 and chances underneath 10 percent seen a month prior. Since 1994, the Fed hasn't raised rates unless the fates market had evaluated in no less than 60 percent of the move the day preceding, Bank of America loan cost strategist Mark Cabana wrote in a March 11 note.
The worries lay on worldwide monetary and money related advancements and their impact on US work business sector and expansion, take an example china problems.
A higher than expected rate is positive/bullish for the USD, while a lower than expected rate is negative/bearish for the USD.
 |
| fed rates |
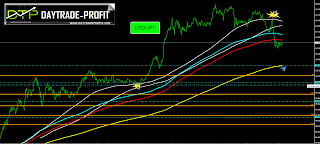
USDJPY
Usdjpy plays the range, consolidation pattern 110.80-114.60
Strong resistance at 120.40
Support level below the lowest price will target level at 106.00 area, as long as the usdjpy stay above 106 meaning the bullish trend didn’t over yet, but keep staying below 114.60 is not a good sign
Moving above 114.60 will lead to 116.40 resistance while crossing this level could give us the 118.20 area
as i mentioned my last post
 |
| usdjpy |
Gold
We saw the triangle pattern in the charts show offTechnical analysis now can show us the up movements were chosen
Gold broke up the triangle and made pull back for testing Triple Border
Now the gold expected to find support at 1224, and a fall through could take it to the next support level of 1189 and even to 1170. The pair is expected to find its first resistance at 1287-1291, and a rise through could take it to the next resistance level of 1324 Meanwhile, the long-term trend remains bearish unless we see him cross up 1360 area, we could see also that 1172 is very important area for continuing this trend
 |
| gold |
Audusd
Strong resistance at 0.760-0.7720
Support level 0.7360-0.7420
Move Above the strong resistance will confirm the next level at 0.82-0.83 area while staying below 0.7360 put the audusd for more downside moves- meaning the bearish trend didn’t over yet
 |
| audusd |
Strong support at 1.2960-1.3060area
Support level 1.31
Move below 1.2960 will confirm the next level at 1.2690-1.2720 area, while staying above 1.31 put the option for more correction to comes to 1.38 area
Cross up again 1.4030 meaning the bullish trend didn’t over yet
 |
| usdcad |
GBPUSD
Here we have another story, GBP/USD rebound from 1.3825 but I’m still viewing the current rebound as a correction moves- the bearish trend didn’t over yet
Below 1.4130-1.4260 support it will turn back to the downside
Strong support at 1.4130-1.4260 area
Support level 1.4360 for continuing the corrections up
Move above 1.4470-1.4520 will confirm the next level at first 1.4640 area, and then to 1.4830 area staying again below the lowest price put the option for more downside to comes to 1.35 area and even less
 |
| gbpusd |
from the technical side as I mention the last post - the pattern suggests the bullish trend, for the coming trading sessions, pointing that the prices creating a possible bullish pattern that its confirmation wti level situated at 39-40 $
From the other side, this pattern also suggests some corrections after reaching the target. Breaking down 36.20 followed by 35.10 levels will send the crude oil to cope with 33$
 |
| crude oil |
NASDAQ 100
Strong resistance at 4460
Support level 4230
Move Above the strong resistance will confirm the next level at 4560 area while staying below 4230 put the NASDAQ for more downside moves- meaning the bearish trend didn’t over yet
 |
| nasdaq |


No comments:
Post a Comment