Identifying signs of a potential market top can be
challenging, as market conditions can vary and indicators may differ across
different market cycles. However, here are some general signs that investors
and analysts often consider when assessing whether a market may be reaching a
top:
Overvaluation: Elevated market valuations, such as high
price-to-earnings (P/E) ratios or price-to-sales (P/S) ratios, could indicate
that stocks are priced beyond their fundamental value. This could suggest a
potential market top.
Divergence: If there is a significant divergence between
market indices and other indicators, such as declining trading volumes, weakening
breadth (the number of stocks participating in the market rally), or declining
market momentum, it could be a sign that the market is losing steam.
Investor Sentiment: Extreme bullish sentiment, as reflected
in measures like high levels of optimism, excessive speculation, or a surge in
retail investor participation, could indicate a potential market top. This is
because markets often experience a period of euphoria before a correction.
Economic Indicators: Weakening economic indicators, such as
slowing GDP growth, rising inflation, tightening monetary policy, or
deteriorating corporate earnings, may suggest that the market could be
approaching the top.
Technical Analysis: Technical indicators, such as trend
reversals, bearish chart patterns, or negative divergences in oscillators like
the Relative Strength Index (RSI), can provide signals of a potential market
top.
Predicting the exact timing of a market correction is
challenging, but there are several signs that investors and analysts often
consider as potential indicators of an impending correction. These signs can
include:
Overextended Bull Market: If the market has been in a
prolonged period of upward momentum, with significant gains over an extended
period, it could suggest that a correction may be on the horizon.
Elevated Valuations: High valuations, such as elevated
price-to-earnings (P/E) ratios or price-to-sales (P/S) ratios, relative to
historical averages or industry norms, could indicate that stocks are
overvalued and susceptible to a correction.
Deteriorating Economic Indicators: Weakening economic
indicators, such as slowing GDP growth, rising unemployment rates, declining
consumer spending, or weakening corporate earnings, may signal an economic
slowdown and increase the likelihood of a market correction.
A shift in Central Bank Policies: Changes in monetary policy,
such as interest rate hikes or tightening liquidity measures, can impact market
sentiment and potentially trigger a correction.
Market Sentiment and Speculative Behavior: Excessive
optimism, increased speculation, and a general sense of euphoria in the market
can be warning signs that a correction may be imminent, as these behaviors can
lead to overvaluation and asset bubbles.
Volatility Spikes: A sudden increase in market volatility,
as measured by indicators like the VIX (CBOE Volatility Index), can suggest
growing uncertainty and the potential for a market correction.
Technical Analysis: Bearish chart patterns, such as lower
highs and lower lows, breakdowns of key support levels, or negative divergences
in technical indicators, can provide signals of an impending correction.
It's important to note that these signs are not foolproof
indicators, and market timing is difficult. Corrections can be triggered by
unexpected events or factors, and markets can sometimes remain irrational for
longer than expected.
the last post was: Does the economic situation of the stock market combined with the bond markets reflects the real problem?
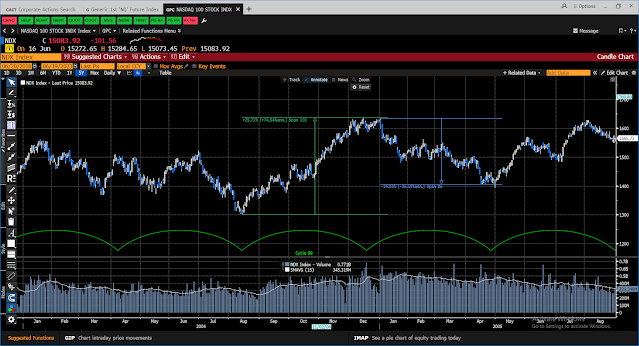
Now let's test the Nasdaq
I think that the max move can play till 15600+_ if this is the right pattern
Correction approved will take place when we will be closed daily below 14630+_
Short support areas: 14200,13400,12600
The big major support stays at 11600+-
An open gap on 13700-13800
 |
NASDAQ ANALYSIS
|
There is a similar scenario that happened in 2004 -time will tell if this scenario will take place in 2023 - if yes so the targets are written above
 |
| NASDAQ |
not yet be
This review does not include any document and/or file attached to it as advice or recommendation to buy/sell securities and/or other advice


No comments:
Post a Comment