Do stock market expectations reflect the situation?
Does the economic situation of the stock market combined with the bond markets reflect the real problem?
We have contradictions in many economic models that we now see in markets and economies, this is not a healthy situation sign - someone will have to reset and get back into balance
Market Uncertainty: In some cases, high bond yields and rising stock prices may indicate market uncertainty or concerns about the sustainability of economic expansion. Investors may turn to bonds, seeking safer and more predictable returns, causing bond prices to decline and yields to rise.
Market Volatility and Uncertainty: High bond yields and rising stock prices can also indicate market volatility and uncertainty. It may suggest that investors are unsure about the sustainability of the current market conditions and are adjusting their portfolios accordingly. This can lead to a mixed or contradictory market sentiment, where some investors seek safety in bonds (pushing yields higher) while others remain optimistic about the stock market
Add to this inverted yield curve in the bond market occurs = yields on shorter-term bonds are higher than on longer-term bonds - * Potential Recession Indicator: Historically, an inverted yield curve has been seen as a potential precursor to an economic recession. In the past, such inversions have often preceded economic downturns, although the timing and severity of the subsequent recession can vary.
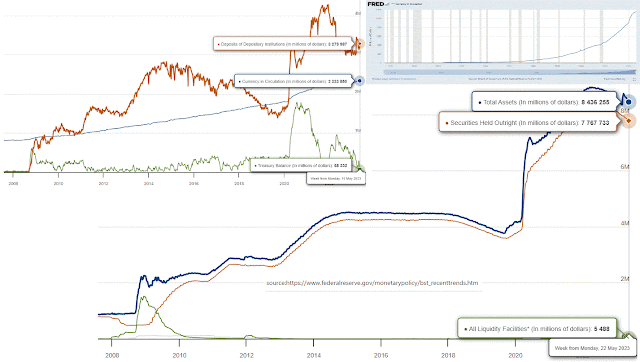
In my opinion, the goal of the Fed is to remove air money from the system - is this possible?
So many years of printing and helicoptering banknotes brought to the financial system real debts on the one hand, profit expectations of balloon companies, and high inflation
It's a very problematic combination, to say the least
If you want to take it out of the system and do a cleanup, then you have taken into consideration that it will charge prices - I'm not sure that the Fed wants to do all the necessary action, he is trying to walk between the drops
 |
| US Credit Liquidity and the Balance Sheet |
I'm not a fundamental trader but I had to show you this side as well, let's move on to the real thing – charts
This time we will focus on Harmonic patterns on the S&P500 - Harmonic patterns, like any technical analysis tool, have both pros and cons
Pros:
Objective Entry and Exit Points
Enhanced Risk-Reward Ratio
Combines Fibonacci Ratios and Price Patterns
Cons:
Subjectivity and Complexity: Harmonic patterns require precise measurement and adherence to Fibonacci ratios, which can be subjective and challenging to identify accurately. Different traders may have varying interpretations of the same pattern, leading to inconsistencies in trade setups.
let's start with the first pattern - Shark pattern
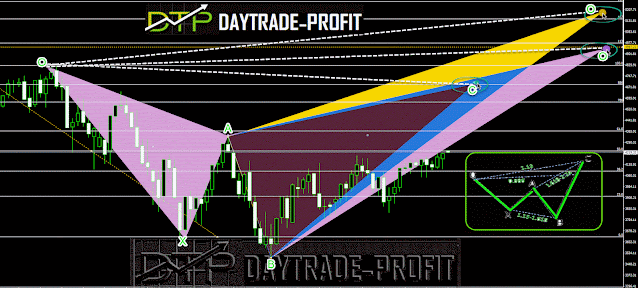
The Shark Pattern it is an extreme harmonic impulse wave using the famous 0.886 retracements - The main factor that differentiates between the harmonic shark and other patterns is that it depends on the 88.6 percent and the 113 percent reciprocal ratios.
The Shark pattern is considered reliable when it adheres to the specific Fibonacci ratios and is confirmed by other technical factors.
• B point needs to be a minimum 113% but NOT exceed 161.8% of XA projection
• C point needs to be a minimum 161.8% but NOT exceed 224% of AB projection
• C point at 0.886 0X (not 0B) retracement of 1.13 0X projection.
• Entry is at 88.6% of OX leg with stops coming in at point C
• Targets can be the golden ratio of 61.8% of the BC leg.
The PRZ points could be: 4690+_/ 4960+_ /5140+_ points
 |
| S&P 500 shark pattern |
Also, we can see the Cypher Pattern
AB leg moves higher to retrace the XA leg. This retracement should bring prices to between the 38.2 to 61.8 percent level of the XA leg.
BC leg moves lower and takes out the swing low at point A, and terminates between the 127.2 and 141.4 projection of the initial XA leg.
The typical range for the BC leg in the Cypher pattern is 1.272 to 1.414 of the AB leg. However, it is also possible for the BC leg to reach as low as 1.13 of the AB leg. This means that the BC leg can be a retracement that is 1.13, 1.272, 1.333, or 1.414 times the length of the AB leg.
CD leg moves higher and terminates near the 78.6% retracement level of the price move from point X to point C.
The PRZ points could be: 4450+_ / 4530+_ /4600+_ points
The Cypher pattern is known for its defined structure and adherence to Fibonacci ratios. When the pattern aligns with other technical factors such as support/resistance levels or trend lines
 |
| S&P 500 cypher pattern |


No comments:
Post a Comment