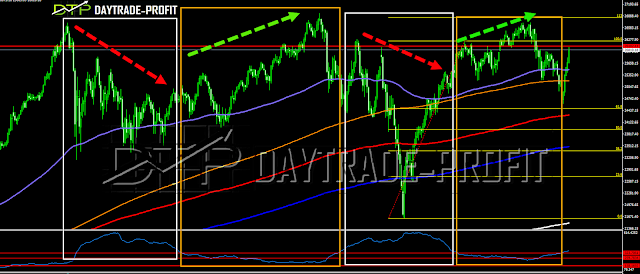
Is the strong run of the indices are real Or perhaps there is something hidden here?
Markets Analysis
I am not inclined to argue with the price graph, but must say that this time I have fears that the move we saw last week does not necessarily reflect the future - there are a few things that cause me to worry.After I scanned the stocks, the indices, the commodities and the foreign currency, the conclusion is certainly not unequivocal. There are a few things that show a contradiction between price levels in the indices and the surrounding environment
Dollar Yen is one
The Dow is the second
And the stock I chose this time is Facebook - these do not show an unequivocal trend of affirmation and support in the process, so let's take a look
this time I'm not determined, but it's not exactly what we see or maybe I'm wrong - I'm a human being too.
I will start with Dow Jones for a long time showing weakness in relation to the rest of the indices
From January 2018 began the stuttering in the index - so far all is well and good, it does not mean anything right?
Not exactly - note the oscillator I developed - you can see that when he was below the values of area 323 + _ the move was positive by all opinions and we saw it twice,
But this time it has not happened yet!
If he does come down from there then we will be strengthened to a positive move if not, it is another story
 |
| Markets Analysis |
Last post I wrote: get a recipe for tomato salad
we
should pay close attention and keep eyes open: one index (DJ) is trailing
behind, while the other 2 (Nasdaq +sp 500) are leading the sled of Santa Tramp,
will 2 dogs chase the slow dog to increase the pace, or is he slowing down the
rest of the journey?
only
the Dow seems to be behind them - for getting approve on the DOW i want to see
him cross 26,830 points - if
so then we can get for more uptrend to 27600+_
Facebook is still negative as long as it trades below $ 179-183
Only a cross-section of these areas will signal a positive moment and an opportunity to close the Gap left behind
 |
| Facebook Analysis |
Technically view on the SP 500 index:
SP 500 move above 2863 points – this is bullish sign ! ----- but for those who wants to be sure and take long position I would recommended to see the nest 2-3 days for getting approval for this action and watch closely for 2928-2938 points to take any action .
short term trend will became bearish as long 2863+_ points will not hold, if the SP 500 failed to trade above 2805 +_ points - we should expect for more lows level : 2710 /2640 and even 2400 points
The big trend is still up as long 2400+_ points will hold
 |
| SP 500 analysis |
There are a few things you should pay attention to The indices
reach extreme levels before the journey continues upwards, or is this the end of the correction?
Facebook has released reports yesterday and costs over 11% - comes to check the Gap, the refractive levels of the rising move: if it closes above the $ 171 area, we have a set up here to catch a move to close the top - it's worth watching closely!
Amazon, as I have mentioned several times, should cross the 1760 area in order to show a continuing upward trend! If the conditions that I have mentioned exist, expect another incremental move
If not then the story is different:
This review does not including any document and / or file attached to it as an advice or recommendation to buy / sell securities and / or other advice


No comments:
Post a Comment