The history of a never-ending melody always remains whether the markets are now before the encore
3-4 months from now it seems that something big will happen
the question is, are we currently in that mid to late-90 ’s stock market scenario, or more of the post-1998-1999 environment. my opinion is that we are in that latter market environment. Therefore my analysis would lead us to believe that this signal will indeed eventually have negative ramifications for the stock market, but meanwhile, we are in long-term in strong up move in the stock market- I would like to see a rise in the indices before falling - which means high yield in the short term
It usually comes before falling -Nothing, but nothing, does not rise in a straight line forever, There is no property in history that has only risen
There are always tides, corrections, and trends in the financial markets
More than once I mentioned and again I mention my thoughts about the market in the last year - you should look at the dollar pair especially USDJPY to see the correlation analysis
Now after 2 rounds of corrections in the financial markets this year
The first began at the beginning of the year
And the second we are experiencing now Are the markets facing the third time that it will be the decisive moment? Or was it just heating and taking the air out of the bloated balloon?
There is something that caught my eye and if this is indeed the case, we have an interesting and challenging period in the financial markets for the coming years
It is possible that we are predicting a scenario that has appeared in the past, and we should follow and examine the picture closely
If the parallel is appropriate, and the imagination continues, then we should expect strong moves in the market
2 possible scenarios that I want to show you:
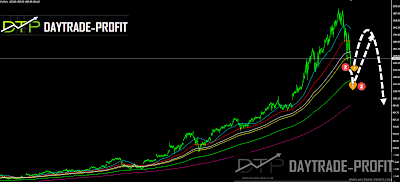
The first scenario: the probability that we saw the bottom for the next few months in the Amazon stock - area 1410 + _, and therefore expect to rise towards the level of 1860 + _, there may be another slight drop to shake weak hands towards the level of 1390, but no more, so that the scenario will take place.
The second scenario: the probability that we did not see the bottom and the stock will not hold the low in the 1410 area and descend towards 1280 points
And from the above-mentioned area, it is expected to rise towards the level of 1860 + _, In order for the scenario to take place, the stock should not be broken.
 |
| amazon chart |
In any case, the picture is not so rosy, if the identification is correct, then in both cases, if the level of 1860 does not break, then the situation is negative for the longer term, about the NASDAQ if we will get retercemant than we should expect to see 7300+_ price area
3-4 months from now If these scenarios are likely to happen we will see something big in the market - maybe this will be the avalanche .......
Amazon stock does show us the state of a bubble asset, based on the graph, the sharp angle, the stall and the duration of the rise - just understand the essence of the matter. In 2008 the paper was worth $ 50 and today Amazon is trading over $ 2000 - 10 years of crazy return.
 |
| amazon stock analysis |
This review does not include any document and/or file attached to it as an advice or recommendation to buy/sell securities and/or other advice


No comments:
Post a Comment