NASDAQ and Amazon stock charts What can they say for the future?
NASDAQ Technical analysis future prediction
as told you last post: " next post ill going to write a few words on the NASDAQ and Amazon stock to see and guess where we are heading ......stay tuned.
we saw declines and rising but what is interesting is the strength and the ability of the market to attract moves of strong movements?
let's start and see what are those assets - More than once I mentioned and again I mention my thoughts about the market in the last year - you should look at the dollar pair especially USDJPY to see the correlation analysis I'm going to talk about
the question is, are we currently in that mid to late-90 ’s stock market scenario, or more of the post-1998-1999 environment. my opinion is that we are in that latter market environment. Therefore my analysis would lead us to believe that this signal will indeed eventually have negative ramifications for the stock market, but meanwhile, we are in long-term in strong up move in the stock market- ן would like to see a rise in the indices before falling - which means high yield in the short term
It usually comes before falling -Nothing, but nothing, does not rise in a straight line forever, There is no property in history that has only risen
There are always tides, corrections, and trends in the financial markets
 |
| NASDAQ Analysis |
Looking at the NASDAQ index you can see that the index shows extraordinary power but ... and it is a great grief Until when nothing lasts forever
Statistics is a wonderful tool, but it is a tool relevant to certain times and past behaviors that have been and were the basis for conclusions - but what happens, that there is an exception, and the statistics do not catch up - what then?
There are high tech stocks, and hi-tech is the tool that drives the world today in innovation and stock markets because the world has been in this direction for many years and from there come all the innovations and developments that drive the simpler sectors in the economic world, such as traditional industry, agriculture and more
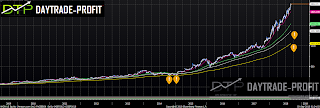
I will try to estimate if the index can continue based on the graph - based on technical indicators only at the moment - an average track of price behavior can show us something interesting:
The previous crisis that experienced an index in 2007-8 can be seen as the last move that was very bullish and with a strong right angle, but this is not the focus of the matter at the moment - the focus is precisely on the escape from the framework of the moving averages,
Pay attention to the yellow strip, and the last move in 2007, in the case of today - 2018, which will probably continue into 2019, suggesting that the target is currently 8600 + _ points
There we will check the index again and evaluate the situation again
Amazon: shares Amazon is a very popular stock among hedge funds. As of the end of the second quarter of 2018, there were 137 funds holding shares of the online retailer of Amazon.com
the major conceivable threats to Amazon on the horizon are antitrust action |
| Amazon analysis |
The Amazon stock does show us the state of a bubble asset, based on the graph, the sharp angle, the stall and the duration of the rise - just understand the essence of the matter. In 2008 the paper was worth $ 50 and today Amazon is trading over $ 2000 - 10 years of crazy return.
The graph is clearer than in 2017
Now you will probably ask the question of where?
From an in-depth study and analysis of the technical parameters we can expect to see the Amazon share continue to rise to new heights: the first major and important level is 2168 + - if it crosses this level, we can even see the share rise to 2518-2610
 |
| Amazon forecast |
This review does not include any document and / or file attached to it as an advice or recommendation to buy / sell securities and / or other advice


No comments:
Post a Comment