The Euro Dollar pair recovers and returns to trade again above 1.16 levels, Is the correction over or ...
EUR USD Analysis
As I wrote last post EUR/USD we will see retracement – closed daily above 1.1430 will lead to 1.1630 and even more up targets such as 1.1670 and even 1.1740
EUR/USD succeeded to take out 1.15 support, break up again on daily basis 1.1760-price level will confirm medium term rally resumption and target next key at 1.1880 and even 1.2080 However, sustained price below will extend the consolidation pattern from 1.2091 with another decline through 1.1300 support.
in the bigger picture, this is still seen as a corrective move for the moment.
In case of another rally, we'd expect retracement of 1.2560 to 1.1500 at 1.1880 to limit upside and or even to yellow strip at 1.2080 and bring reversal.
Break up again on a daily basis 1.2560-price level will confirm medium term rally resumption and target next key Fibonacci level at 1.2860
While break again last lows will confirm for more downtrend to closed old GAP from 2016 who located in 1.0770 price area
 |
| EUR USD Technical analysis |
Technical analysis:
After the last retracement - we saw EURUSD took off 1.1630 – and reached to 1.1670 – targets were mention – now what :
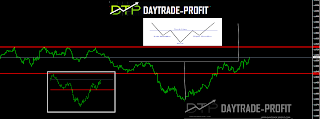
Next target area if the price will remain up above 1.1670 is 1.1740-1.1770 – if those targets will break up we need to expect for more up moving in EURUSD to 1.1880-1.1910 – see inverse head and shoulders pattern – SHOWS THE SAME TARGET
This pattern can only be confirmed once the market makes a close above neckline resistance. The period required for this close depends on which period is best respecting the neckline. In the EURUSD example above, the 4-hour chart was respecting the level and also displayed the most accurate rendition of the pattern, therefore we needed a 4 hour close above the neckline to confirm the pattern.
One method of finding a profit target is to use a measured objective. To find the objective, you simply measure the distance in pips from the head to the neckline. You then project that same distance from the neckline to a higher point in the market. The measured move, on the other hand, represents the distance traveled from the neckline to the objective.
Although you should combined use of a measured objective along with key support and resistance levels to get initial profit
 |
| EUR USD PATTERN |
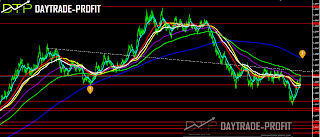
Support resistance stay in 1.1530-30 while break again last lows will confirm for more downtrend to closed old GAP from 2016 who located in 1.0770 price area
 |
| EURUSD Chart |
This review does not including any document and / or file attached to it as an advice or recommendation to buy / sell securities and / or other advice


No comments:
Post a Comment