The markets set new highs after the big correction at the beginning of the year, where are they headed from here?
Markets technical analysis forecast update
Long time I didn’t talk on financial markets indexes such as the sp500/ Dow Jones and Nasdaq, I think it’s about the time to say a few words and try to put here Possible future projections for those markets , Especially after this week we saw new record highs in U.S. stock market after the big drop earlier this year –was expected ! |
| markets analysis |
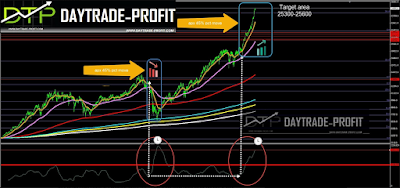
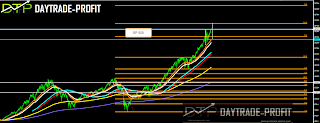
the last post I wrote on markets an option I mention was to continue drop to the area 23,100-23,300 + and from there exit to an ascending process – pay attention to last rally (started at October 2016) I deliberately put the Fibonacci levels on the charts A 38.2%-61.8% retracement is the minimum requirement for a pullback - you can see that the best correction level for the last rally in the markets is in the area 23,100 + _ points- see post here
My short term forecast suggest for more continue up move with apx 7-8% target on index from the last top record break such as the sp500 (2880+- points last record ) – is supposed to give target’s on the sp500 (3040- 3110 points) ,2968-2978 will be first resistance on the sp500 ,support stay in 2820- 2853-2874 points for this move .
Also for the Dow Jones 30 that still not managed to take off the last record
 |
| SP 500 analysis |
Is the Recent Rally of Trump in the markets about to end?
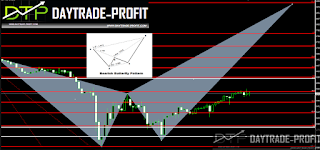
The long-term forecast could suggest even more upside on the index - last February post shows very interesting ideas
 |
| DOW JONES Analysis |
This review does not include any document and/or file attached to it as an advice or recommendation to buy/sell securities and/or other advice


No comments:
Post a Comment