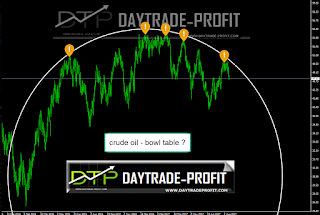
Oil shows signs of inability to cope with price levels of over $ 53 as expected , what the next move ?
crude oil technical analysis forecast
Oil shows signs of inability to cope with price levels of over $ 53, what the next step Choppy trading pattern in WTI crude oil, which has lasted 14 months. As we hit another peak, the risk/reward favor is a move back down, unless we break out above $53.The ability of the industry to continue to access finance is critical for its survival. As long as Banks continue to provide capital to the industry, it can continue to drill. With so much capital Chasing yield, there is an opportunity for banks and the capital markets to gain from the junk Bonds and lending to the industry.
Low-interest rates are, in effect, making the endeavor viable – and thus keeping oil prices Down. Interestingly enough, that result means that low rates are creating deflation in the most
An important commodity in the global supply chain
 |
| crude oil forecast |
From EIA - Energy Information Administration
what drives crude oil prices:
“U.S. crude oil production is estimated to have averaged 9.2 million b/d in August, down about 40,000 b/d from the July average. Crude oil production in the Gulf of Mexico fell to a monthly average of 1.6 million b/d in August, down by 70,000 b/d from the July level. At the time of publication, many oil production platforms in the Gulf of Mexico had returned to operation, and EIA forecasts overall U.S. crude oil production will continue to grow in the coming months. EIA forecasts total U.S. crude oil production to average 9.3 million b/d for all of 2017 and 9.8 million b/d in 2018, which would mark the highest annual average production in U.S. history, surpassing the previous record of 9.6 million b/d set in”
U.S. crude oil production forecast expected to reach record high in 2018 .
According to eia prediction gasoline price should remain more or less on the current levels , as for gasoline pieces they should be stay between 2-2.5 $ per gallon
Cot Position Map:
Positioning is highly extended: swap dealer raised bearish bets on oil for the seventh week in a row to the highest level since august 2013
producer raised bearish bets on oil for to the highest level same as January 2015 priming the market for a steep reversal- similar behavior appears in 2015 see the charts
 |
| oil position map |
 |
| crude oil position map |
Technical analysis update:
After the pattern archived: as I mention the last post- the pattern suggests the bullish trend, for the coming trading sessions, pointing that the prices creating a possible bullish pattern that its confirmation wti level situated at 52-53 $, from looking at the charts we can see also the resistance at 52-53 area This pattern also suggests some corrections after reaching the target. Breaking down 48.20 followed by levels will send the crude oil to cope with 41-42 $look on the white strip - you can see clearly the block on the upper areas - 52-53$ prices
 |
| crude oil technical analysis |
This review does not including any document and / or file attached to it as an advice or recommendation to buy / sell securities and / or other advice


No comments:
Post a Comment