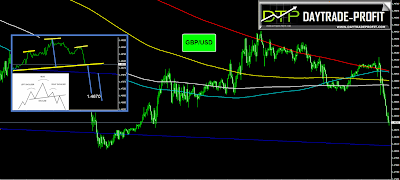
gbpusd price technical analysis update
Why the Next Years of GBP USD Will Smash the Last 10
From my last post:
http://www.daytrade-profit.com/2015/12/gbpusd-technical-analysis-update.htmlMove below1.48200 first (A long-term bearish target is projected towards the level of 1.4800 for this reversal pattern.). Decisive break there will pave the way back to 1.4480 -1.4565
Break down those levels would target 1.3503 prices and below later.
we could see even lower numbers below 1.30
we can pattern in the charts of head and shoulders:
Head and Shoulder pattern consist of the following:
1. Left Shoulder: In continuation of the uptrend, the price goes up to forms a new high or first peak known as left shoulder and then make a low.
2. Head: Continuing the left shoulder low, again the price goes up to a new high, higher than the left shoulder forming a middle peak called as head of the pattern and come down.
3. Right Shoulder: It is formed when the price goes up again from the low of the head but not as high as the Head and comes down forming a third peak or right shoulder.
4. Neckline: It is the line drawn through the bottom of the Left Shoulder, Head and the Right Shoulder and serves as an important support for this pattern.
The profit target for the pattern is the price difference between the head and low point of either shoulder that's mean that if we will look on the charts we will retarget
1.4650-70 area as target price
good luck to all and happy new year
 |
| gbpusd |
This review does not including any document and / or file attached to it as an advice or recommendation to buy / sell securities and / or other advice


No comments:
Post a Comment